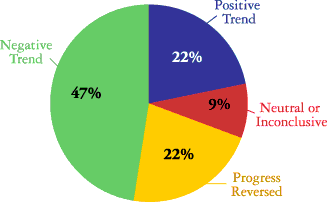
Two-thirds of the indicators in this report show a negative long-term trend or reversal of a positive trend.
![]()

![]()
|
|
|
|
||||||||
Environmental impacts per person are generally stable or improving. However, overall environmental impacts are increasing as population grows and the economy expands. Silicon Valley's residents and workers are generally becoming more efficient at reducing consumption and waste. However, these improvements in individual efficiency are being offset by a growing population and economic expansion. For example:
- Each person disposed of 873 fewer pounds of garbage in 1998 than in 1987 -- a 30% decrease.
- After years of decline, total tons of garbage disposed jumped 19% since 1994.
- Each person used 60 fewer gallons of water per day in 1998 than in 1987 -- a 24% decrease.
- Overall water use has increased to near pre-drought levels.
- Each person used about the same amount of energy and generated the same amount of carbon emissions since a decade ago.
- An increase in the number of drivers and vehicle miles traveled has fueled a 20% overall increase in energy use and a 19% climb in total carbon emissions since 1986.
Santa Clara County's population has grown by nearly one-third in two decades -- about three-quarters of this growth is driven by new births. Each person has a large impact on the environment.
|
|
|
|
||||||||||||
Americans comprise only 4% of the world's population, but we use 25% of its resources. The indicators in this report show that when we choose to take action, we can reduce our impacts and improve environmental quality. Examples abound. Water use dropped by 27% from 1987 to 1991. In the face of growth pressures, we have increased the density of urban land use from 8.06 people per acre in 1984 to 9.48 people per acre in 1998. Challenged by a state law requiring cities to cut their waste in half, Santa Clara County slashed its garbage disposed by 624,000 tons (30%) in 7 years.
We phased out ozone-depleting chemicals and reduced local releases of toxic release inventory chemicals by two-thirds in 7 years. We are cleaning up leaking fuel sites and controlling non-native species that threaten the endangered California clapper rail. We have cut non-residential use of the most toxic pesticides in half in 6 years. We have even improved air quality significantly despite drastic increases in vehicle miles traveled.
The challenges ahead are to protect against recent reversals in some of these positive trends, and to address tough problems that persist and are growing.
Transportation is perhaps the single largest contributor to environmental impacts in Silicon Valley. The Valley's 1.1 million registered drivers affect the air we breathe, the water we drink, and the land we use.
Vehicles are responsible for more than half of our air pollution and have accounted for virtually all of the increase in carbon emissions over the past decade. The gasoline additive MTBE has seeped into our water sources and is now detected at low concentrations in our drinking water. Runoff from brake pads is the single largest contributor to copper in our rivers and the South Bay. Some of the compounds in Polycyclic Aromatic Hydrocarbons (PAHs), pollutants entering the Bay primarily from vehicle exhaust and crank-case drippings, are known to cause adverse effects in fish, wildlife, and humans, and they accumulate in sediment and shellfish tissue. Also, reliance on automobiles encourages low-density land use patterns, although the Valley is using urban land more efficiently than in the past. Besides threatening our health and contributing to global climate change, the ever-increasing number of vehicles on the road cause gridlock and erode our quality of life.
162 rare species are found in Santa Clara County or may be affected by projects in the County. While better information is needed about the status of these species' local populations, it is clear that they are impacted by human-induced pressures. Farming, salt production, and urbanization have shifted the composition of South Bay wetlands and decreased acres of critical habitat, including an 84% reduction in tidal marshes since 200 years ago.
With reduced habitat, species have become more vulnerable to other stresses, particularly competition from non-native species. Discharges from ship ballast water have helped to make the San Francisco Bay the most invaded aquatic ecosystem in North America, and the rate of invasion is accelerating. In the shallower parts of the South Bay, introduced species account for the majority of species diversity. On land non-native red foxes and feral cats nearly decimated local populations of the endangered California clapper rail until controls were enacted that led to a 160% increase since 1991.
Watershed improvements have been achieved in some areas, but serious challenges remain. With decreases in some industrial discharges such as copper and nickel, urban runoff (including oil, pesticides, and metals) persists as a threat to water quality. Leaking fuel tanks have decreased by more than one-third since 1994 and drinking water quality remains good, but MTBE is showing up in our water sources. So-called legacy pollutants, such as DDT, PCBs, and chlordane, whose use and production was banned due to their adverse environmental effect, still persist in our environment and continue to accumulate throughout the food web. With high population growth and associated development pressures, it is perhaps not surprising that watershed health is being challenged.
BACK | TOP | CONTENTS | 1999 ENVIRONMENTAL INDEX | SVEP HOME | NEXT
Website developed by Clary Meuser Research Associates