The Film is the Swindle
Sponsors
<-- Return To Climate Shift
Source: Campaign Against Climate Change.
Channel 4 : Great Global Warming Swindle
Posted March 9th, 2007 by jo
Where do I begin ? After watching "THE GREAT GLOBAL WARMING SWINDLE" on Channel 4 this evening with growing disbelief, and much shaking of the head, I came to the conclusion that the film itself is the swindle :-
http://www.channel4.com/science/microsites/G/great_global_warming_swindle/
I decided to start by deconstructing the GRAPHS shown in the film, but there is more, much more, to upick. I really don't know how a major TV Channel allowed the Film to be peddled, without checking out the basic facts, unless they too are part of the great swindle. Here are just a few of the incredible errors :-
1. The Legendary Medieval Warming Period
The graph that was used in the film seemed to be based on a chart for localised European temperatures that was constructed about 15 years ago. When you look at more data sources, from a variety of proxy and direct measurements, and look more globally, the Medieval Warming Period is seem as a true bubble in a small teacup compared to very recent global average temperature change. The science has moved on. Why are people still stuck in the past over the legendary MWP ?
http://en.wikipedia.org/wiki/Image:Ipcc7.1-mann-moberg.png
red line = IPCC 1999
blue line = IPCC TAR 2001
black line = Moberg et al 2005
http://upload.wikimedia.org/wikipedia/en/c/c1/2000_Year_Temperature_Comparison.png
2. The Fabled Little Ice Age
Again, it seems that cooling was mostly in Europe, and since that was where the majority of people lived at that time, it's not surprising that all anecdotal evidence is about cooling. If you look at more data sources, from a variety of proxy and direct measurements, globally the temperature can be smoothed quite remarkably, and the LIA is seen to be a mere passing phase of no great magnitude, unlike what is happening now in terms of Global Warming :-
http://www.pages2005.org/mediaroom/paperpics/mann1.gif
http://www.usefulinfo.co.uk/images/cetann.gif
Also, there are a number of human-related factors that could have helped to create the Little Ice Age, from the mass burning of trees for industrial purposes, to changes in agriculture.
http://www.atmos.washington.edu/2004Q4/211/hockey_etal.gif
Sponsors
3. The Holocene Maximum
So, like 8,000 to 10,000 years ago, the Earth started to heat up and became warmer than it was today ? You got Global Warming at around the time of the first major attempts at human civilisation, when humans started to cut down trees to burn, and plant crops...oh yes, maybe humans had something to do with this...It's not true to say that humans had no impact on Greenhouse Gases in the atmosphere until they started to burn Fossil Fuels.
http://www.ace.mmu.ac.uk/Resources/gcc/figures/5_18.html
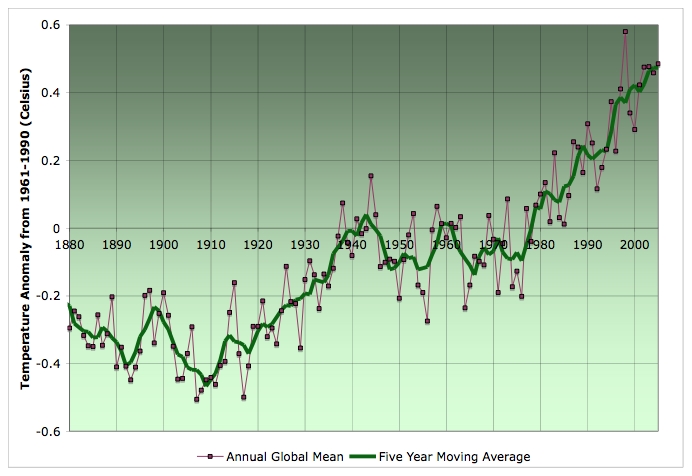
4. The Post-War Cooling Period
It depends on which data you look at, as to whether the Post-War Cooling Period was four decades of consistent decline in temperatures or not - and again - on the global scale is less of a downwards trend than a plateau :-
http://www.metoffice.gov.uk/research/hadleycentre/obsdata/globaltemperature.html
http://www.actewagl.com.au/education/
http://www.theoildrum.com/uploads/12/global_temperature.jpg
http://www.grida.no/climate/ipcc_tar/wg1/figspm-1.htm
http://hadobs.metoffice.com/hadcet/graphs/HadCET_graph_ylybars_uptodate.gif
The period after the Second World War was clearly a time of great industrialisation, and enormous particulate emissions, which have now been shown to cause Global Dimming, the dirt in the air acting as light shields, reducing the warming effect of the Sun's radiance :-
http://www.bbc.co.uk/sn/tvradio/programmes/horizon/dimming_prog_summary.shtml
As the makers of the programme point out, since the 1970s global temperatures have been rising - which neatly coincides with the attempts by the industrialised countries to clean up their act. Cleaner air means more incident radiation on the oceans and land which means more global warming. What we are seeing now is the true impact of increased Carbon Dioxide emissions on the Greenhouse Effect. One major blip being the particulate emissions in Asia, which are perhaps preventing full Carbon Dioxide induced warming, but are contributing in their own way to warming and drought and storms :-
http://news.bbc.co.uk/1/hi/sci/tech/6421303.stm
In summary, their use of old/localised graphs does no favours to the film makers, and their simplistic arguments do nothing for their case.
If you were to follow the argument put forward by Timothy Ball in the Swindle Film, that Carbon Dioxide cannot possibly have a big effect, as it is present in very small amounts in the atmosphere, consider this : it is a very efficient absorber of radiation in the part of the spectrum which includes sunlight reflected from the Earth's surface
http://www.bom.gov.au/info/climate/change/gallery/images/4.jpg
It is a very efficient part of the blanket of gases that keeps the Earth liveable. If it weren't for Carbon Dioxide and water vapour in the atmosphere, there would be no mammals, or in fact, not much of any life at all.
Several of the interviewees in the film say that the Sun is all, the Sun is the largest influence. Well, that would be true if it weren't for the atmosphere and the part played by Carbon Dioxide. And you must know that, taking into consideration many factors such as solar sunspot changes, cosmic ray cloud nucleation changes, Earth's Poles precessing and volcanic activity, at the moment the Earth should be experiencing a cool-down. It's not.
http://www.newscientist.com/data/images/archive/2486/24861403.jpg
And this is even before I begin on the political manipulation of the interviews...
<-- Return To Climate Shift
Didn't find what you are looking for? We've been online since 1996 and have created 1000's of pages. Search below and you may find just what you are looking for.
Michael R. Meuser
Data Research & GIS Specialist
MapCruzin.com is an independent firm
specializing in GIS project development and data research.
We created the first U.S. based
interactive toxic chemical facility
maps on the internet in 1996 and we
have been online ever since. Learn more about us and our services.
Have a project in mind? If you have data, GIS project or custom shapefile needs contact Mike.
Contact Us
Report Broken Links
Subscribe for Updates


