MapCruzinTM Learn2MapTM Tutorial and Atlas
Copyright © 2006, Michael R. Meuser, All Rights Reserved
(ISBN 0-9713214-6-9)
Introduction -
Startup -
Sample Project -
Your Project -
Add More -
Free GIS -
Conclusion
3. RUNNING ARCEXPLORER WITH A SAMPLE PROJECT
 Go to your computer's start menu and run ArcExplorer 2.0. Your computer should have put it in a menu folder named "ESRI." When first run, ArcExplorer should look like this.

Once ArcExplorer is running, click on the top menu item "File" and scroll down to and click on "Open Project."

 Navigate to c:/mapcruzin_maps (or the directory that you chose to install your maps in). Once there, double-click on "scruz.AEP." (Note that an alternative to this is to use Windows Explorer to navigate to the folder and file, scruz.AEP. Once there, double-click on scruz.AEP and it will open the project in ArcExplorer).

 In the ArcExplorer map window you will see a map of Santa Cruz County, California. By default, all of the layers are turned on. You can turn various layers on and off by checking or unchecking the box to the left of the map layer's name. For now, leave them all on.
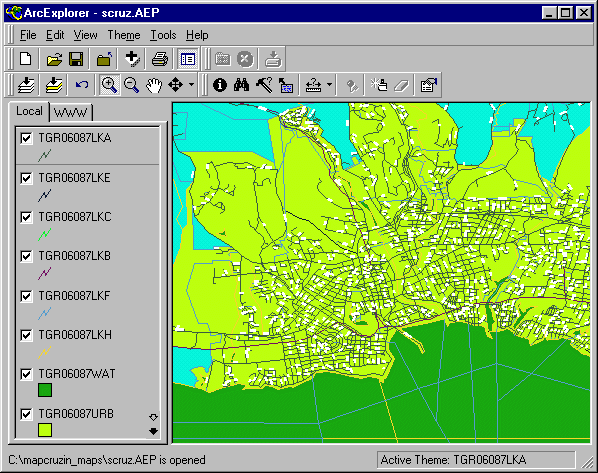
 First, you will learn to become familiar with the basic navigation tools. Click on the small magnifying glass icon with a plus (+) on it.
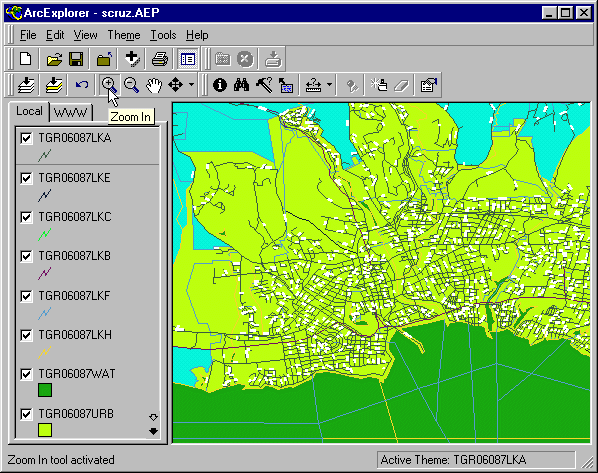
 Now move your mouse over the map, hold down your left button and draw a box.
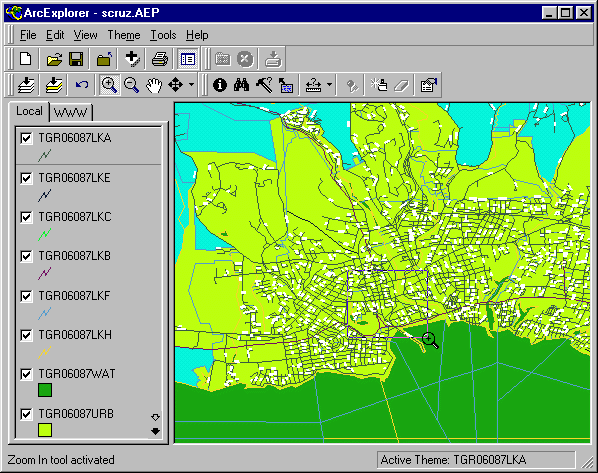
 Release the button and your map will zoom-in providing more detail.

 Now click on the hand icon.
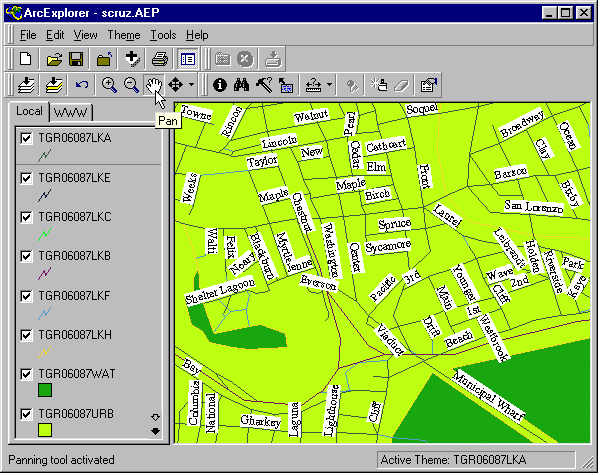
 Move your mouse over to the map once again and you will see that your mouse pointer has changed to a hand icon.

 Hold down your left button and drag the map to a new location and release the button. The map will redraw at the new location. This is known as "panning."
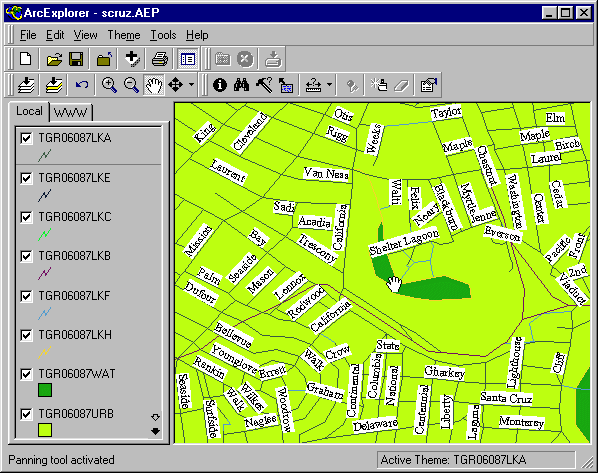
 Finally, click on the small magnifying glass icon with a minus(-) symbol.
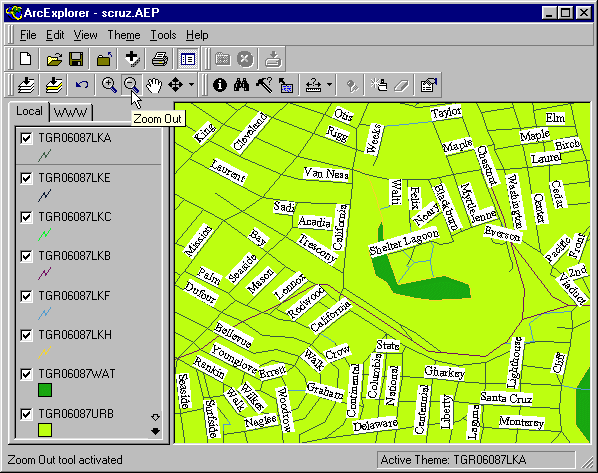
 Click anywhere on the map and the map will zoom-out centering on where you clicked.

 Now you will learn to identify features on a map. I set "roads" as the top layer. It is the topmost layer on the map itself and on the theme menu to the left of the map. The roads layer is named "TGR06087lkA" (more about these obscure names below). To obtain information about a feature in a layer, the layer must be highlighted. Click on the name of any layer and you will see a raised box appear around it.
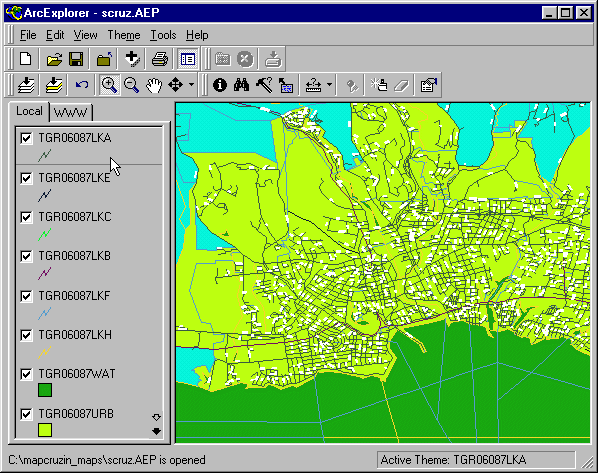
 Click on the information tool (a black circle with the letter "i" on it), move your mouse pointer to the map, place its point on a road and click the mouse button.

 A box will open up showing all the information in the database related to that road including its name.
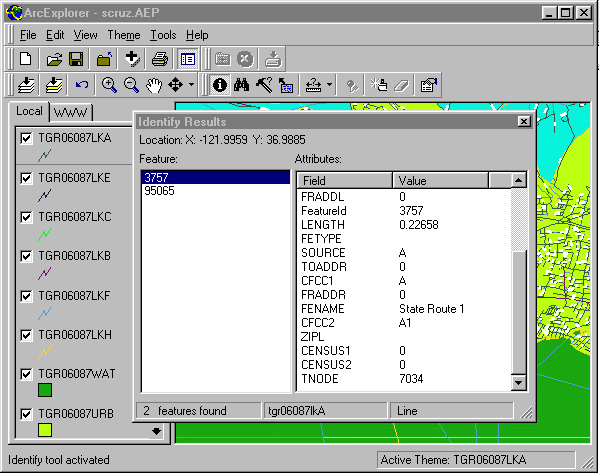
 Layer names like "TGR06087lkA" are named that way in the Tiger files. To find out what these layer names mean, click on the file "readme.html" in your c:/mapcruzin_maps/ directory. An internet browser window will open up. You will see that files with that end in "lkA" as the above file does, are "Line Features - Roads." That is a little less obscure at least.
 Now go back to ArcExplorer, click on the name of the top layer "TGR06087lkA" to highlight it if it is not already highlighted. Now double-click on "TGR06087lkA" and a box will open.
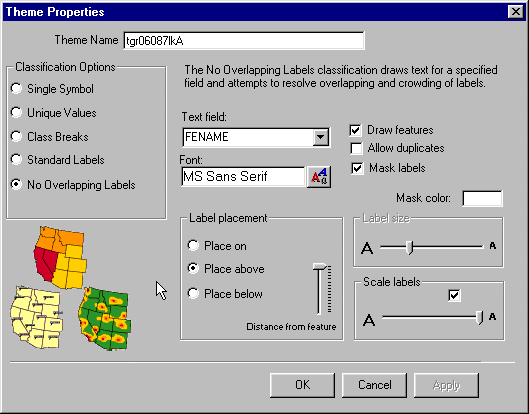
 You can change all sorts of theme attributes. At the top you can change the name of the theme to something like "Roads" or "Streets." Give it a try. This is also a good time to experiment with the other attributes. Change colors, label sizes, etc. -- play with this for awhile.
 Here is another one to try. In the last example, you were changing the attributes of a line layer -- roads, streets and highways. In this example you are changing the attributes of a polygon layer. Highlight layer "TGR06087WAT" and double-click on it. This dialogue box looks a bit different than the last.
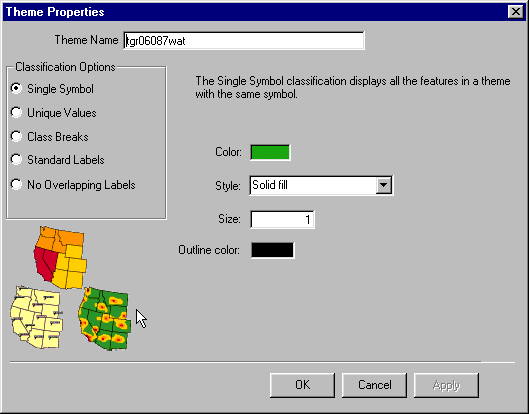
 This layer happens to be the water body layer. Normally water is colored blue on maps rather than green, so let's change the color to blue and change the outline to a darker blue.
 First, double-click on the green color box and and a dialogue box should pop-up that looks like this.
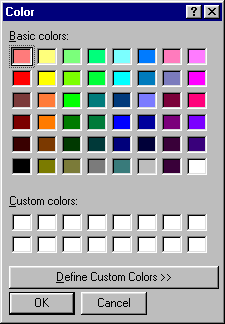
 Click on any blue that you like for your water color. Now close this box and you will be back to the water layer dialogue box. Double-click on the black "outline color" box and change the outline of your water layer in a similar fashion. You also change styles, line sizes, and other things. Experiment! If you chose color similar to mine, your map should look something like this.

 Remember, you can't break anything. At worst, you can go to the "File" menu and choose "Close Project." When asked if you would like to save the project, answer "no." When you reopen the project it will be just like it was when you began the tutorial. BUT, if you like what you have done so far, by all means save it. If worse comes to worse, you can reinstall the project by re-running the "scruz.exe" program as described earlier in the tutorial (2. GETTING STARTED).
 To maintain the original project and your new project go to "File" and "Save As" and choose a new name for your project. Now you will have both the original and your modified project.
 As you go through the "readme.html" and identify the various layers, you can change their attributes and rename them so that they make more sense to you. You can also turn various layers on and off by checking or unchecking the box to the left of its name. Try unchecking the topmost roads layer. You will see that your map now redraws much faster. This is because the roads layer has much more data than any other layer in the project. The more data you have, the slower the map gets.
 You can also reorder your layers and define which layer is on top, which is on the bottom and the order of all those in between. Do this by placing your mouse pointer over the layers name, holding the left button down and dragging the layer up or down to a new location. As you do this you will discover that some layers have obscured others. Getting the layers in the "right" order and all their attributes "correct" is one of the major tasks of a digital cartographer. Take some time getting familiar with this.
 Fun stuff. This is neat and it will also give you a sense of how "real" cartographers choose attributes for their various layers. Make sure that you are online and click on the tab "WWW" at the top of the map layer menu. Now double-click on "AE Web." A box will open with "ESRI ArcExplorer Web Site" - click on "add url." You will see that 3 subcategories have been added. I clicked on "USA Basemap" and came up with this.
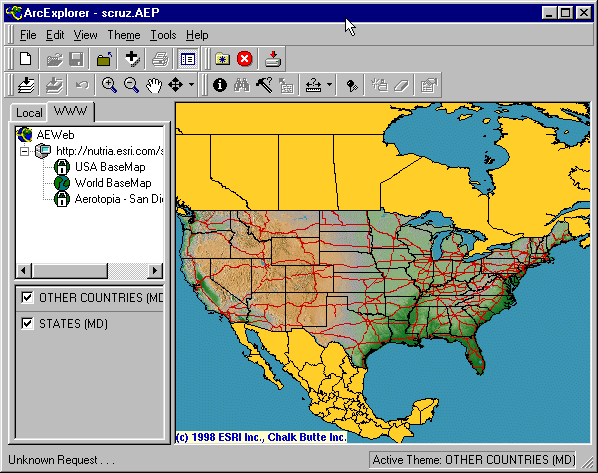
 Double-click "USA Basemap" and some themes will appear. Now zoom-in and more themes will be added - pretty nifty. You can zoom-in, zoom-out, navigate and identify features on this map just like you can with your offline project. Take some time here and have some fun while you learn.
Continue --> 4. YOUR FIRST MAP PROJECT
|
|


